How to find portfolio/audience fit
You’ve probably heard of Product/Market Fit. It’s widely seen as the holy grail for just about every early-stage startup – and for good reason.
But what happens when your product doesn’t really feel like a product; when you have a portfolio rather than a product?
And what about when you’re focused not on a specific market with highly specific and aligned pain points, but an audience – where everything feels more fluid and diverse?
When you don’t identify with a singular product or a specific niche market, it’s pretty hard to find product/market fit.
If you’ve got a portfolio of projects and an audience that’s hard to categorise, the playbook on fit… well, doesn’t fit.
Between the gaps
As with my recent attempts to fit into 34″ waist jeans, I’ve wrangled with this for some time. The advice ‘you have to focus down on a really specific niche’ never appealed. It always felt limiting, constraining, and weirdly conventional; a bit like skinny jeans, come to think of it.
Perhaps you know what I mean.
But working on multiple projects, I’ve also sensed tension surfacing. Operating largely solo with limited resources, time, and energy, it’s challenging to hit a moving target.
To remedy this, I tried out some of the popular Product/Market fit guidance for my portfolio. It always seemed kinda rigid and clinical, and I found myself with awkward offcuts; making weird hacks. Classic brand strategy approaches felt too unwieldy and laborious.
They were Saville Row tailors and posturing athleisure startups, when all I wanted was a few pairs of Levi’s.
Was I doing it wrong?
Was there something missing?
Or should I just conform?
These frustrations were highlighted by three conversations I had in the space of a few days.
First, I was told getting stuck between B2B and B2C is not a good place to be. It creates pressure. Pick one. Then ask the the questions:
“Who is the niche audience I could serve for 5 years?”
“How could I be famous to them?”
Pondering this for a while, it felt like B2B made most sense.
I shared this advice with someone I trust. This was the second conversation. They pushed back: whether or not they work in a company, companies aren’t the customers; people are.
Whether B2B or B2C, it all came back to people. Focus there first.
Third, I spoke to a successful author and entrepreneur who suggested to simply:
“Pick customers you like, then keep releasing products in the same space. Use your career capital, and compound the resources you build.”
Synthesizing all of this together, I knew there was some strain and pain that I needed to relieve.
There was career capital I could use. There were customers I could choose.
And yet it was still really easy to feel squished in the middle; caught between the gaps; somewhat squeezed in the crown jewels.
Unable to find the combination of leg length, waist size, cut, and color.
Sketching the space between
A few days later I was writing my Morning Pages when two thoughts hit me in quick succession:
What do you do if you feel caught between the gaps?
Find the overlaps.
What do you do if writing isn’t helping solve the problem?
Eat chocolate. Draw.
I scratched out a simple Venn diagram. A few quick iterations later and I had something that seemed to hold together.
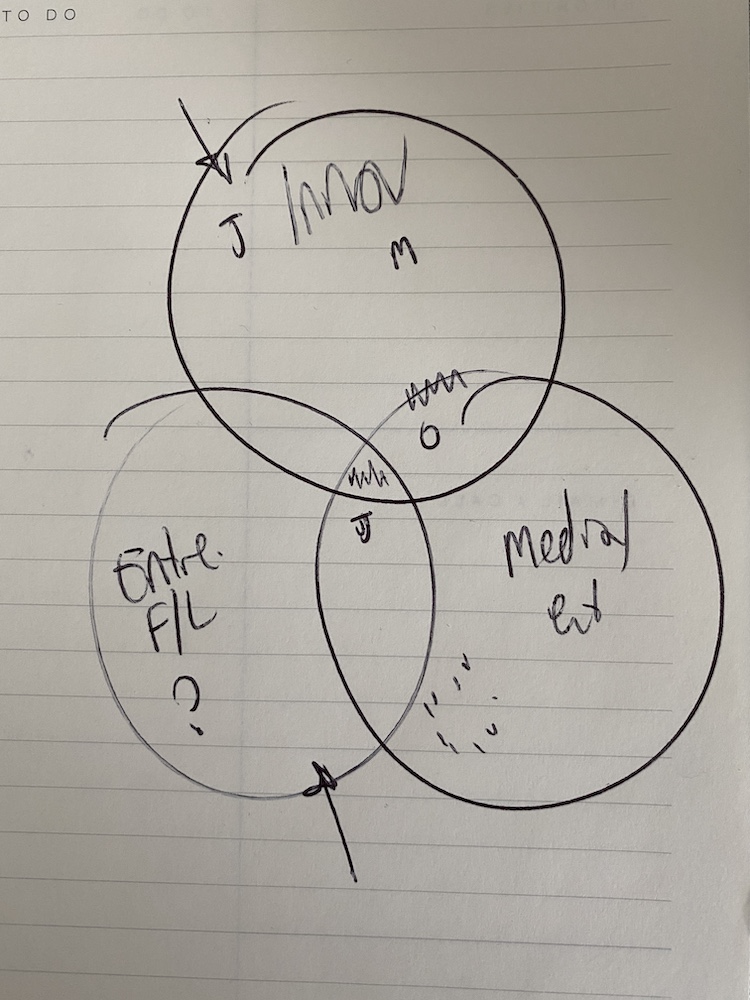
As if by magic, some kind of flow state kicked in, and in a couple of hours I had the first draft of what is now this step-by-step guide to what I’m ostentatiously calling “Portfolio/Audience Fit“.
I share this in the hope it’ll be as helpful to you as it has been to me.
Before we get into it, though…
Practical Notes, Caveats, and a few words for the Haters
- You can read this guide in about 10 minutes. It’s worth allowing an hour or two to do the exercise
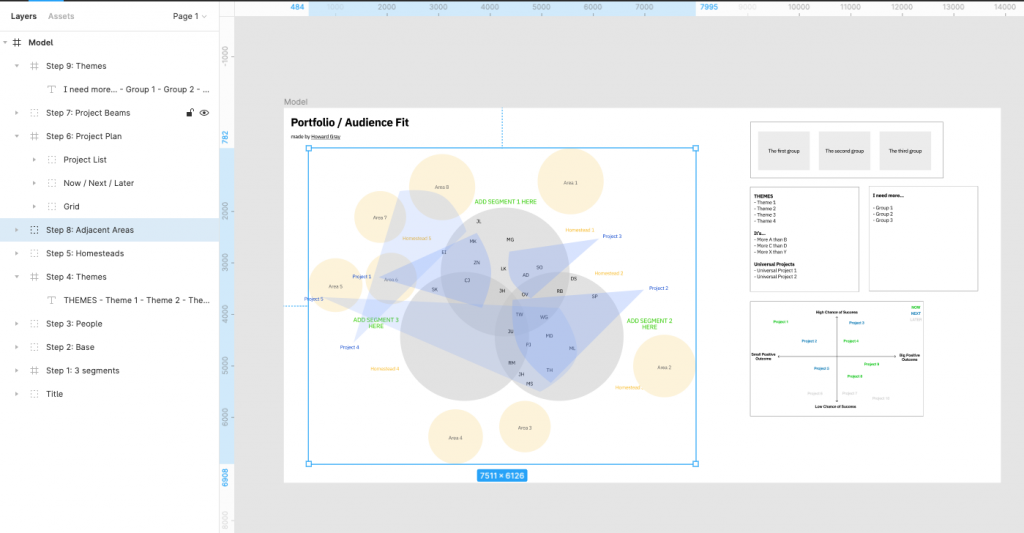
- I did this in Figma. You can do it however you like (but my Figma template will speed it up)
- I’ve aimed to keep these steps as succinct as possible. If you have any questions or clarifications, feel free to drop me a note
- Although I did think about changing this to dummy content, I decided to use my own real audiences and projects here. Eek
- There are probably some nifty consulting frameworks that do something similar to this, but in a more robust way. Feel to share them and make me look like a skinny jean wearing simpleton
- I expect plenty of people to scoff that market = audience, you should only focus on one product at a time, and this whole thing is a waste of time. Maybe you’re right. But it worked for me. So yup.
- This method isn’t ironclad and hasn’t been tested at scale, but I’ve found it very helpful. Your mileage may vary
- Most of this post was written while listening to Involver by Sasha
Ok, that’s the formalities over. Let’s get going.
A guide to Portfolio / Audience Fit
Step 1. Choose your areas
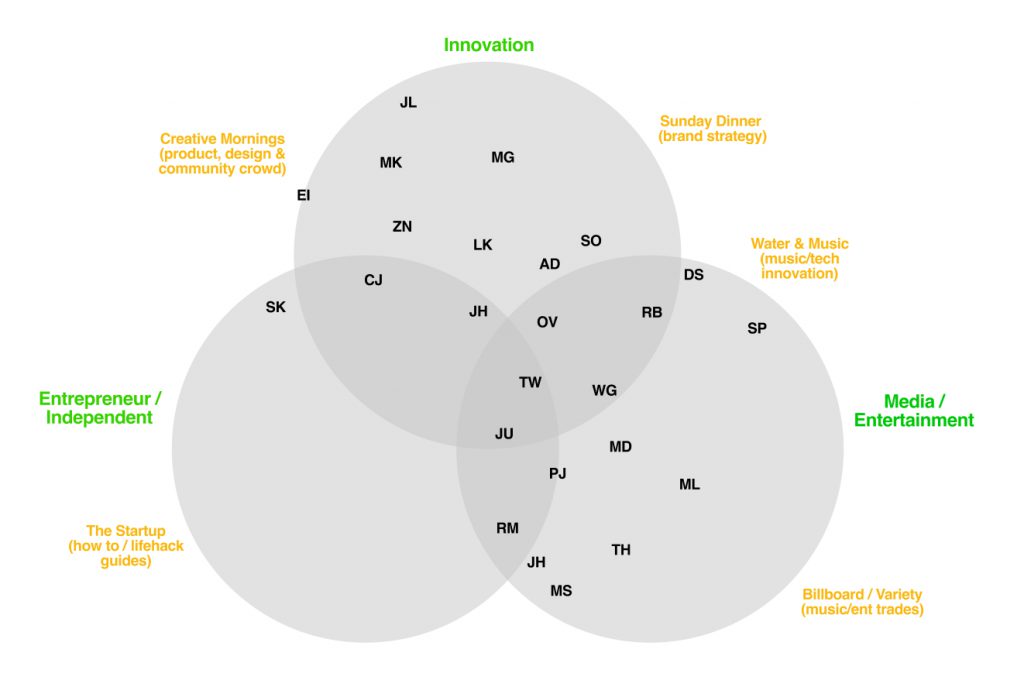
These are your more generalised segments. Figuring out what these are is out of the scope of this guide (it’s already 3000+ words), but I suggest three is a good number for this. To illustrate what I mean by ‘segment’, I chose ‘Innovation’, ‘Entrepreneur/Independent’, and ‘Media/Entertainment’.
Note: If you’re curious, I chose ‘Innovation’ because it surfaced a lot during user research for Wavetable; ‘Media & Entertainment’ because I spent nearly 10 years working in and around it; and ‘Entrepreneur/Independent’ because I am one, and my writing has always leaned towards ideas for this group (oh, this like post – how lovely!)
Yours could be ‘Ex Wall Street IT Managers; ‘Software Developers’; or ‘Graphic Designers based in Mexico”.
These groups may feel really broad, but counter-intuitively this approach can work really well. And if not, you can always change or retool them later.
In either case, the goal is to pick out 3 areas that cover a decent portion of your existing/desired audience.
Step 2. Overlap them
We want to get these into a Venn diagram, because the overlaps are what really matters in our quest to make life less painful for ourselves. Other diagrams are available of course, but the Venn is a classic, and three is the magic number.
Here’s how mine shapes up:
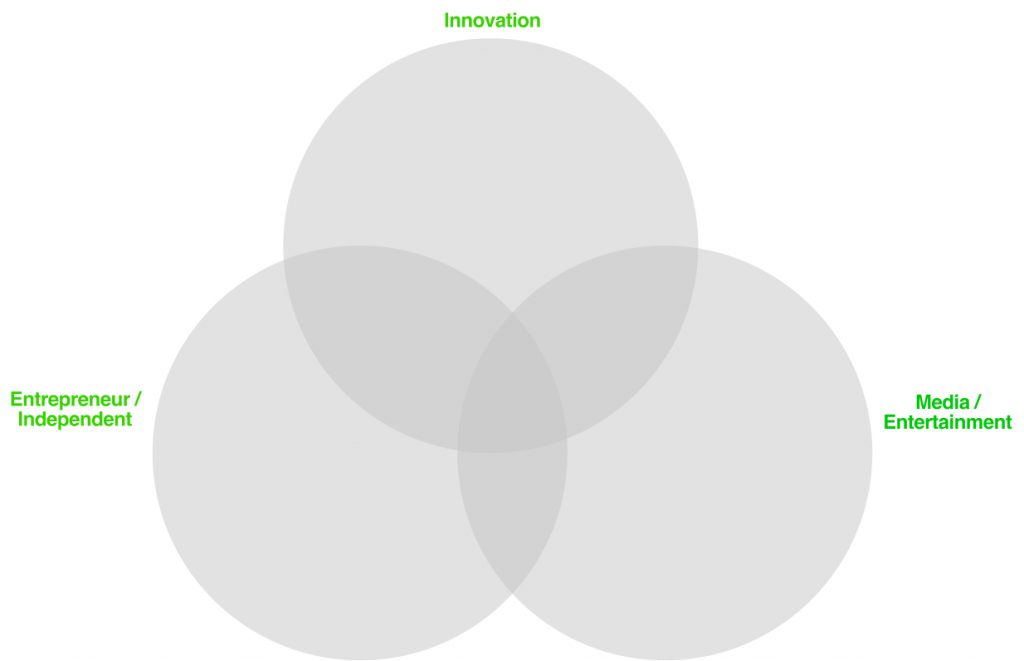
That was easy. Onto step 3!
Step 2. Add people
This is where the fun starts. It’s time to add people to the diagram.
While you could add everyone you’ve ever met, it’s probably better to stick to either:
- A small subset within these three groups, and/or
- The people that come to mind most clearly
However, selecting only your two best friends and your cat probably isn’t casting the net wide enough.
To strike the right balance, here are a few prompts to get you going:
- Avid readers of your newsletter
- Clients who you love working with
- LinkedIn connections who engage with your stuff most
- Pro Tip: your dormant ties
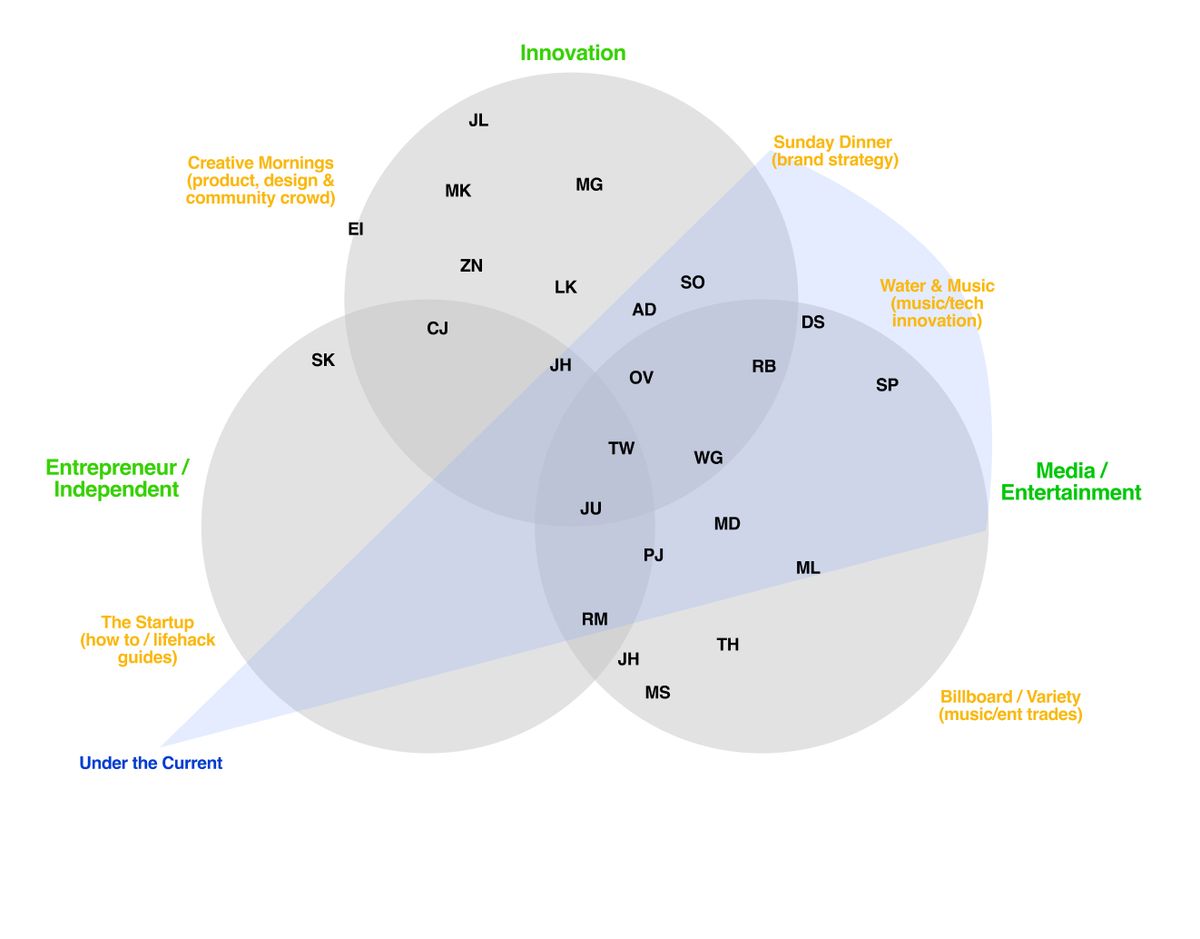
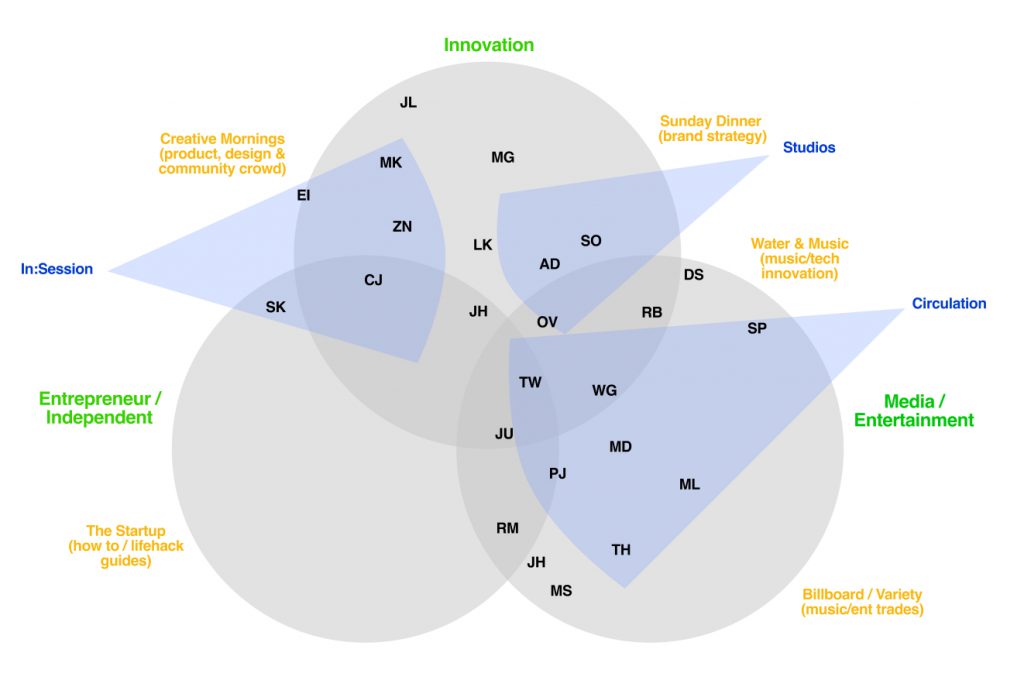
You can list people out separately to the diagram but I find it easier and more useful to drop them straight into the Venn. Here’s mine:

As you do this, you’ll probably find yourself shunting some of them around. This is likely a good thing: as you think a bit more deeply about each person you’ll remember or notice certain nuances and elements to them that weren’t immediately obvious.
For example, I had CJ pegged as a freelancer (left hand circle) but remembered they did a lot of innovation projects, so I shifted up them into the crossover area between the two.
Taking a look at my example above, you may be wondering a couple of things:
- Why is the Entrepreneur/Independent circle so empty?
- Why are a few people so close the edges?
The left-hand circle came up empty because no one on my shortlist fitted there. Simple as that. Whether or not there’s some confirmation bias going on, this was pretty telling. There were a few people I thought about adding here, but something told me that what I’m doing isn’t really for them. I instead decided to focus on the 20 or so that came to mind most sharply.
As for the closeness to the edges, there were two reasons.
First off, a few people were quite far away from the other two areas. Note: you could add a fourth or even fifth area to your diagram, but I find it’s better to keep it simple.
Second, there were other adjacent areas that pulled these people away from the centre. We’ll get to those in step 7 (yeah I know, I jumped ahead a bit).
Before that, let’s flesh this out a little more.
Step 4. Find the themes
At this point, you’ll probably see a few clusters starting to appear.
It’s worth surfacing some themes in these clusters.
There are obvious demographics like age, location, industry, and so on. There are psychographics: people’s behaviors, attitudes and aspirations.
And there are more personal factors such as “do I like this person?!”
Sketch out a few. I scribbled mine on a separate document, or you can annotate the diagram.
You should see some commonalities show up, especially when you look at these notes along with the places where the circles overlap.
For me, this is when I was reminded of that third bit of advice I received: pick customers you like, then keep releasing things in the same space.
This may be also a good time to try out some other ideas, like the ‘More > Than’ exercise: are they more Coachella than Glastonbury; more NYC pizza slice than Parisian bistro; more Gary Vee than Brene Brown?
It’s a simple exercise typically used for brands, but I’ve found it helpful when applied to audiences too.
It’s worth spending some time playing with a few ideas here to help tease out some unexpected themes.
Once you’re happy with what you’ve got, let’s add some more colour to the main areas on the diagram.
Step 5. Add some homesteads
I’m sure there are proper terms for this in the strategy and UX communities, but for this exercise I’m calling call them homesteads (a term I’ve lifted and remixed from a post by Alex Danco).
In this context, I think of a homestead as media or communities that a group gravitate towards. To pin down a few of these, ask yourself questions like:
- Where do they hang out online?
- Where do they go to get advice and feedback?
- How do they stay energized and connected?
- What do they look forward to hitting their inbox? (I particularly like this one)
Again, a solid user researcher or strategist will have plenty of approaches. for this, but hey – this post is freeeeeee.
You can add lots of stuff here, but I find it helpful just to pick out one or two per area of your Venn. Remember, the overwhelm is real, so let’s keep it simple. Again, we can (and should) tweak and adjust later. I definitely recommend going with what comes to mind first as there’s going to be a reason why your brainbox went there…
I think of the homesteads like magnets: places to move towards when seeking more audience members; or to push away from when the fit seems good but is actually pulling you away from where you should be.
Here’s mine with a few homesteads added:
Step 6. Map out your projects
Ok, this is where we really get going!
It’s time to add our projects.
Before we slap them on top of our nice Venn diagram, it’s worth thinking about what our projects actually are.
In time-honoured Howard tradition, I’m stealing a method for this from elsewhere and then adding a couple of bits to it.
This time, the victim of my fully-admitted theft is Seth Godin.
Seth talks a lot about having a portfolio of projects. As you’ve probably deduced by now, I’m also a big believer in thinking this way.
Note: Even if the portfolio approach doesn’t apply to you right now, I still recommend testing this step out
While projects can be wonderful, they can also take up too much headspace; not get off the ground; or pull us in the wrong direction.
Courtesy of Seth, here’s a 2×2 to get clearer on the projects in the portfolio:
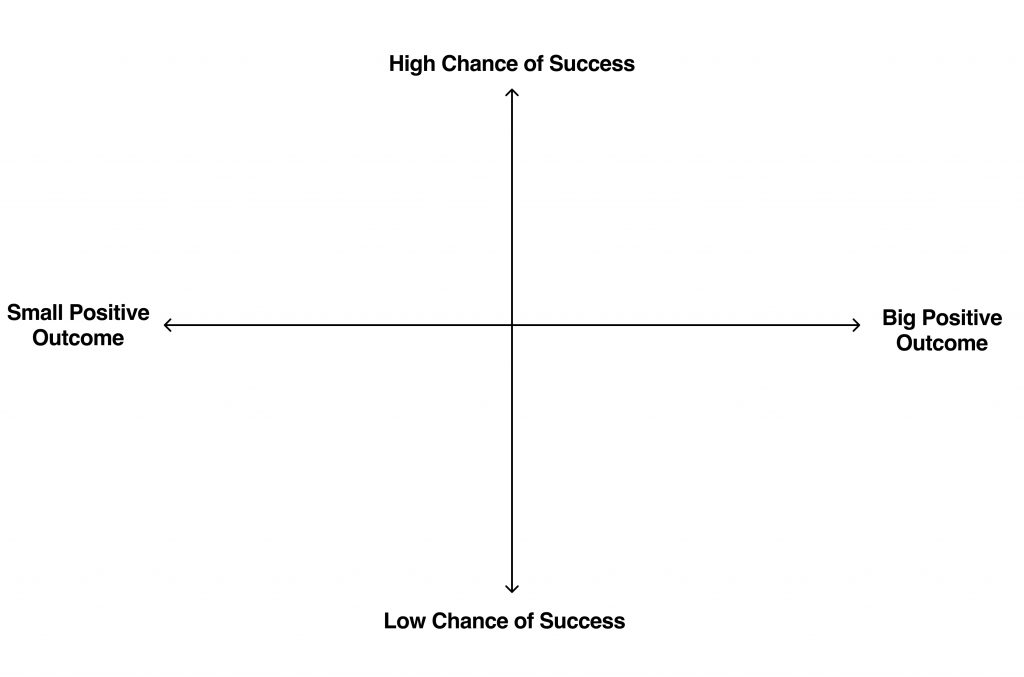
Pretty simple eh?
Of course, looking at these labels we can see we’re speculating a bit here, but life wouldn’t be much fun if we knew it all in advance.
Before filling this out, let’s go over to Seth to explain the model a bit more:
Here are some of the traps that are worth avoiding:
1. All your eggs are in a low-chance basket. You’re taking a wild gamble, and it’s your dream. And you want a shortcut. The problem, of course, is that this isn’t a resilient long-term plan. Someone has to win the lottery tomorrow, but alas, that doesn’t mean it’s going to be you.
2. You’re hoping to come out ahead by doing something that depends on scarcity, but you’re doing it in the top right quadrant. The problem is, so is everyone else. All of a sudden, your odds just went down. It’s easy to start an Insta account, but once everyone does it, the chances of becoming a top .01% traffic generating influencer are close to zero.
3. You focus on only high-probability, low-value successes, even if the outcomes are not really worth your time. Getting a $3 an hour gig on a freelance site is easy, but it might not be worth it.
This is worth pondering for a minute. It’s very simple, but there’s a lot to it.
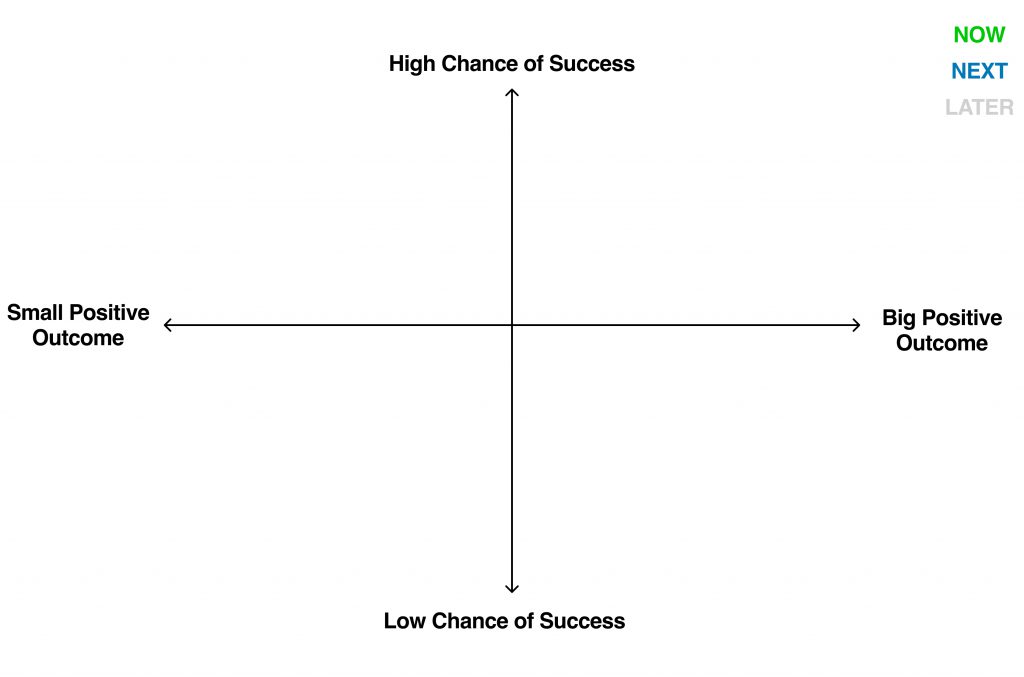
When you’re ready to add your projects, here’s a handy way of doing so.
I added a simple colour code to Seth’s matrix: Now, Next, and Later. We can tag each project with this to get a better feel of when/if we should be giving a project space in our brains:
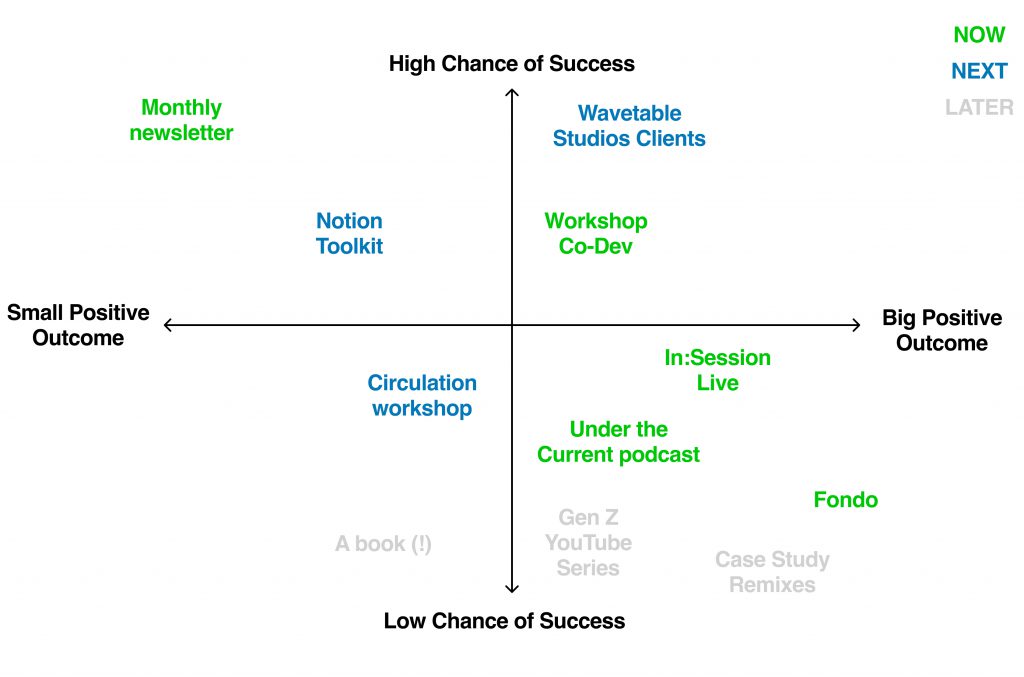
Then, add the projects and colour code them accordingly. Again, it’s worth thinking about each one, and don’t be afraid to shift stuff around. You’ll probably see way too many in the Now and Next categories to start with, and you may even end up switching some projects between quadrants.
This may feel painful, but it’s goooood. Trust me.
In the interests of transparency, here’s my batch of projects (correct at the time of writing):
Now we’ve got our projects, let’s get back to our main diagram.
Step 7. Beam out the projects
First, take the ‘Now’ projects and overlay them onto the Venn diagram.
I used a flashlight-style shape to beam them out across the audience (how ostentatious). The beam is helpful because you can start to see where the project’s seed audience is, and how broad it can – or should – go.
And if it’s not a direct beam (or even a beam at all) that’s cool; play around with your layout to see what fits.
Note: ‘Seed Audience’ is a nifty term I stole (you’re seeing a theme here, right?) from my pal Rob Fitzpatrick
Here’s the first pass at beaming out three of my projects:
I like this step as it starts to show how strong the beam needs to be in order to reach certain people, and if we have the resources to do so.
If you extend this step out a few more times, you’ll have multiple (marketing) beams to help you see what you may need.
When you’re done, you should see some clear themes forming (hint: they’ll probably be at the edges…)
What if it isn’t working?
When I added an additional project, I noticed the beam was a little harder to set in place:

Under the Current (bottom-left) is my podcast exploring creative careers. I’m not surprised it felt tough to map. The guest list is pretty broad: DJs; strategists; magazine publishers, and beyond. The audience appeal is hard to nail down to one group – it’s definitely a theme (per Step 4) than a couple of groups. This left me with a few options:
- Remap this project onto a new diagram that focuses on a few sub-sets / psychographics;
- Redesign the project in some way;
- Convert the project into a ‘Universal Project’: one that serves pretty much the entire audience (my blog and newsletter fall into this category);
- Accept the beam is not going to be very concentrated
It was interesting to see this because the podcast is still in its infancy, and I already had a hunch that it needed something tweaking… I just wasn’t sure what. In case you’re curious, off the back of this I’m going with option 2 – a slight tweak on the value prop and approach to tighten it up.
Still with me? Ok!
We’re nearly done. On to step 8…
Step 8. Include the adjacent
Remember when adding people to the diagram (Step 3) I mentioned adjacent areas? It’s time to add them.
I like the word ‘adjacent’. It’s one of the very few terms I remember from maths classes. More so, I like it because of the concept ‘adjacent possible‘, as coined by Steven Johnson. It’s hopeful, diverse, and a little bit magical.
Anyway, ‘adjacent’ is really just a fancy way of saying ‘next to’.
The adjacent areas are the ones next to those three you chose right at the start. They’re areas you have an interest in, connection to, or affinity for. But they weren’t in those first three.
Mine include higher education, coaching, graphic designers, major record labels, and VC-backed tech startups. Perhaps yours do too.
Whatever they are, with a bit of luck the adjacent areas will quite literally be next to the main three in your Venn diagram. If not, that’s cool – give them a shuffle or a slight renaming and you should be able to get them pretty closely aligned.
It’s also worth sizing them up or down based on your interest and depth of connection to them.
When you’re ready, pop them around the outside of your diagram:
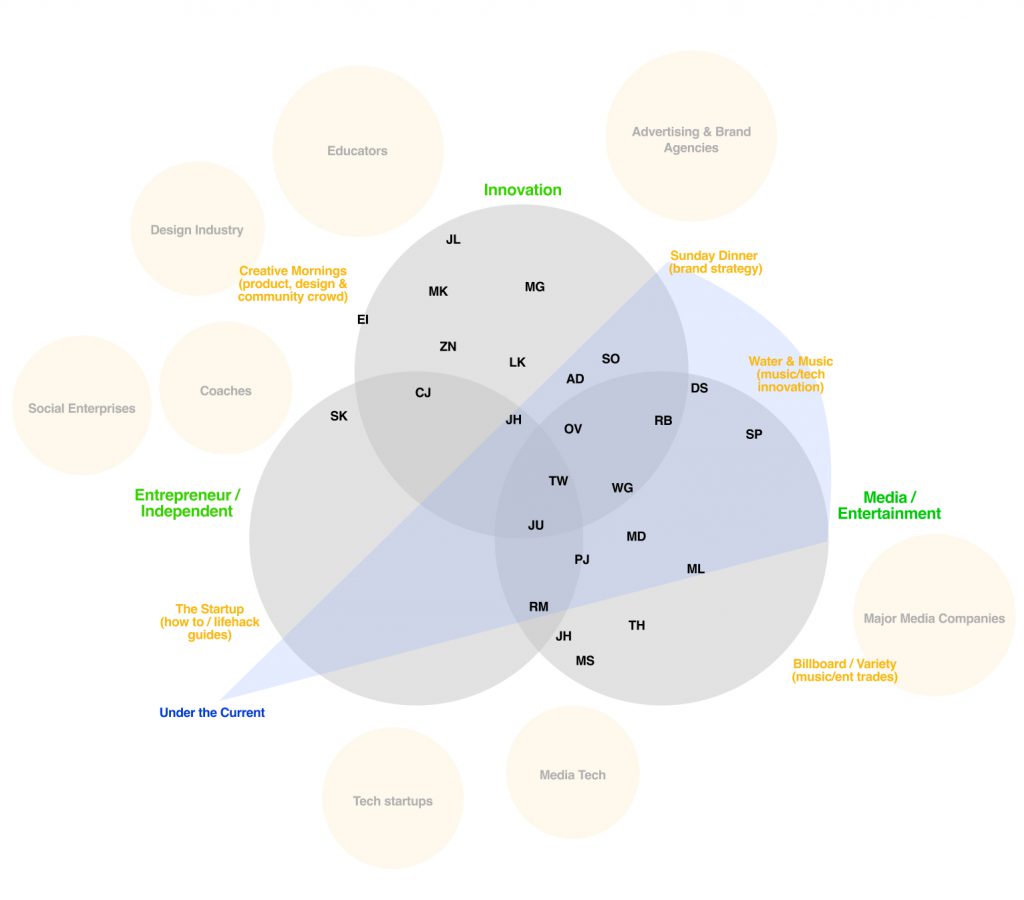
You may be thinking this means shuffling the rest of your diagram up. Yup, it may do. But that’s ok 🙂
As you may have noticed, mine doesn’t hang together perfectly, but it’s pretty close.
The goal of this step is three-fold:
- See the areas or audiences you may be missing
- Extend the beams out as needed
- Get clear on where you’re NOT putting your focus
Tip: You may want to try this step with groups you are uncertain about, or have a strong hunch you need to avoid. It can be very clarifying. As Charlie Munger once said: “All I Want to Know is where I’m Going to Die So I’ll Never Go There”. There’s nothing worse than wasting valuable time and energy on groups we don’t really want to serve.
Ok: last couple of things…
Step 9. Where are the gaps?
There are inevitably going to be some gaps. It’s tempting to fill them.
For me, the ‘Entrepreneur/Independent’ circle was pretty bare – clearly I wasn’t thinking so much about people in this group who weren’t also involved in innovation or media projects. Maybe I want to fill that gap, but right now I probably don’t.
Instead, it’s better to look at the gaps in the beams and ask a few questions:.
- Do the strongest beams hit enough people? Do they hit the right people?
- Who do I need more of?
- Is there sufficient crossover between the beams?
- Can the beam be directed at a slightly different angle? And what happens?
- Do the adjacent areas offer something I haven’t seen before?
- What if a couple of other projects were substituted in?
Take some time here. Sleep on it, reflect on it, go and buy some new jeans and reflect some more.
Once you’ve got a few answers, we can move onto our final step.
Step 10. What next?
Now you’ve followed the process, you can choose to set it and forget it, or keep coming back for tweaks and iterations. I strongly recommend the latter. Things change – especially when you’re building a project portfolio!
Choose a few actions to take from here. Again, 3 is a good number (it’s magic, so they say). Besides, any more than this and things can feel a bit overwhelming.
Here are a few ideas to get you going:
- Find more people to pack into the hotspots (the intersection of the 3 circles, or a point where many projects overlap). For me, that’s innovation people in and around the media & entertainment industry who have also done entrepreneurial / freelance work
- Revisit a project (per the podcast example I shared in step 7)
- Reverse engineer a project: sketch out the most impactful beam (intense and pretty narrow) and think about what that project could be
Kaboom!
Thats it!
10 steps to mapping your portfolio to audiences. Fluid, iterative and organic.
To make it easier, I’ve included the full Figma template ready to go. Just pop your email address in below.
I’d love to hear how this process was for you, as well as any adjustments or improvements. Just leave a comment, or send me a note.